
Active Solar Inverter Cooling – A Customer Experience
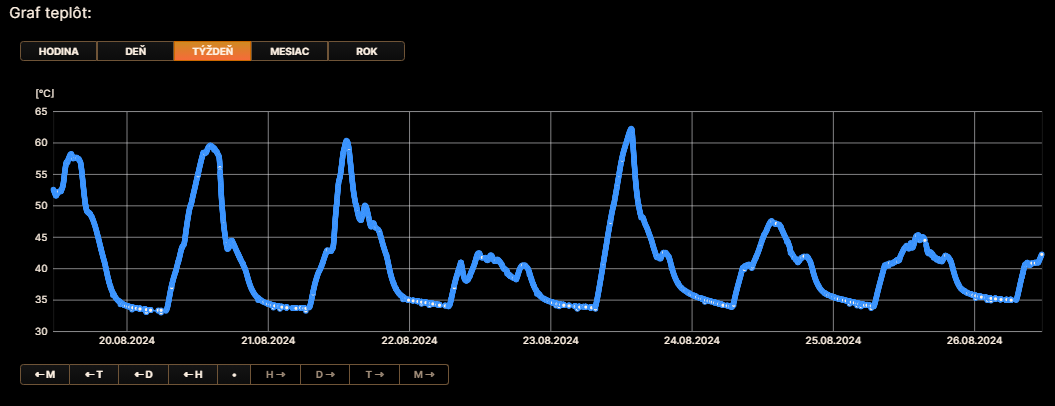
How does the temperature inside a solar PV inverter change after active cooling is installed? Our customer Martin K. shared his experience from everyday operation, together with a graph showing air temperature measurements inside the inverter.
According to the customer, the active cooling system was installed on 24 August 2024, shortly after delivery. He subsequently sent us a graph showing the recorded temperature over time.
Martin K.'s Experience
Original customer message (translated into English):
“Hello, thank you for supplying the cooler, which was installed immediately (24 August 2024) underneath the inverter. I'm attaching a few photos and a temperature graph (air temperature readings inside the inverter).”
We would like to thank our customer for sharing his experience and measurement data.
Air Temperature Graph from Inside the Inverter
The following graph was supplied directly by the customer and shows the air temperature inside the solar PV inverter. According to the notes accompanying the original measurements, the temperature decreased after the active cooling system was installed.
What Does This Customer Measurement Show?
The supplied graph documents a change in the air temperature inside the inverter when active cooling is used. The customer recorded a reduction in temperature after installation.
This is a real-world customer experience, not a laboratory test. Actual cooling results may vary depending on the inverter model, operating load, ambient temperature and installation conditions.
More Solar Inverter Cooling Measurements
Interested in more customer experiences and temperature graphs from solar PV inverters in operation? Explore further measurements of active inverter cooling performance.