Presentation of Cooling Efficiency Measurement Results:
Customer data – Quote:
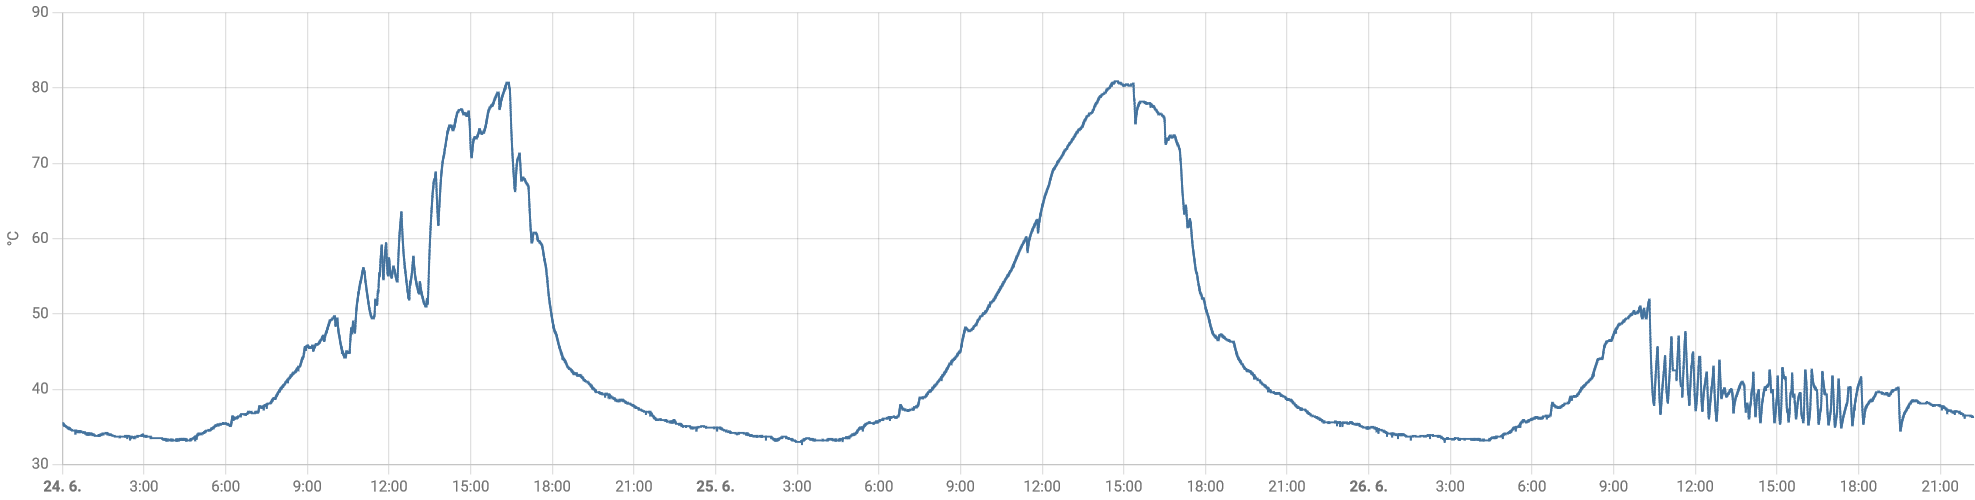
Data for today and the two previous days, power output up to 9kW for all three days. The graph shows the temperature of the GoodWe GW10K-ET cooler.
Comment:
The cooling was presumably installed around 9:00 AM. After installation, a temperature drop is visible, followed by the activation of the cooling system.