GoodWe GW10K-ET inverter, connected panels 12kWp, room size 9m² (31.5m³), wooden structure
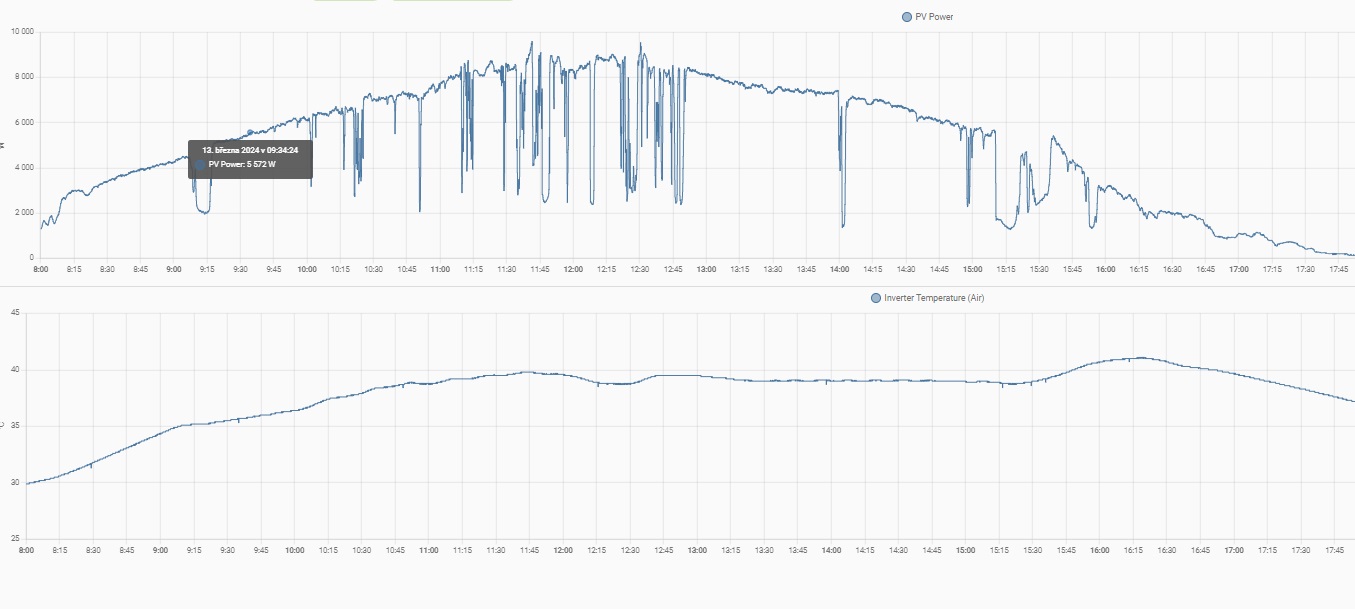
Active cooling installed (March 13, 2024, room temperature 16–18°C) – In the upper part of the graph, we can see the power generation of the plant, occasionally shaded by clouds. In the lower part of the graph, we can see the temperature of the inverter – the sensor is placed near the electronics (temperature_air). This temperature can be read on the SEMS portal or in the SolarGo application.
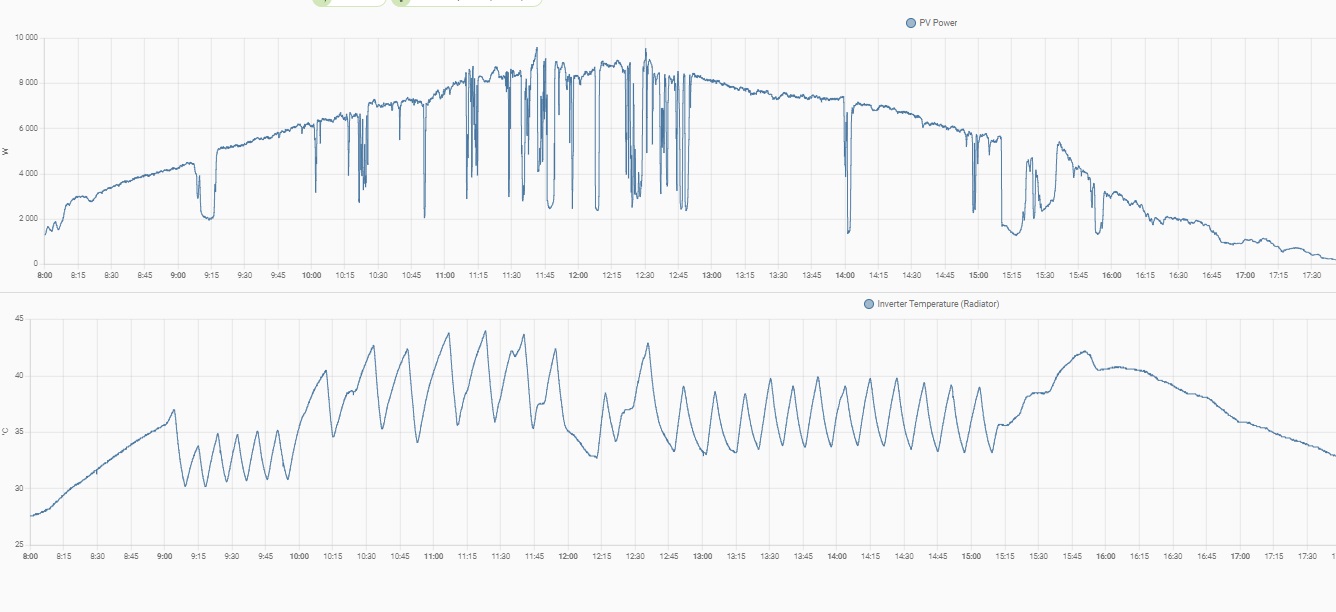
Active cooling installed (March 13, 2024, room temperature 16–18°C) – In the upper part of the graph, we can see the power generation of the plant, occasionally shaded by clouds. In the lower part of the graph, we can see the inverter temperature – the sensor is placed on the radiator (temperature_radiator). The lower part also shows the cooling activation, which turns off at a temperature of 35°C. The temperature measured by the cooling system's sensor slightly differs from the temperature measured by the inverter. This temperature cannot typically be read in the manufacturer's supplied applications.
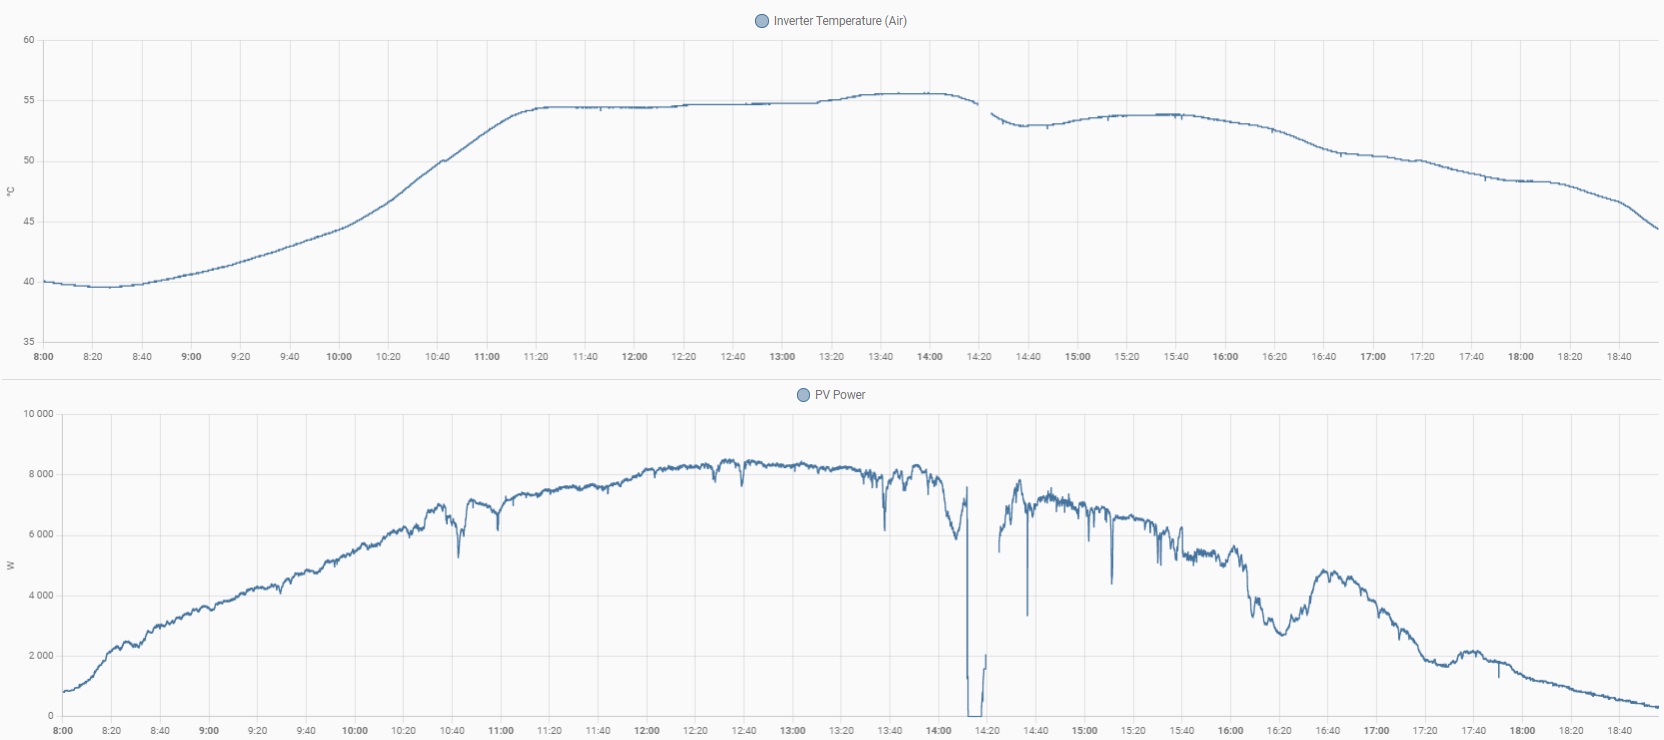
Without active cooling – (April 9, 2024, room temperature 18–20°C) – In the upper part of the graph, we can see the inverter temperature (temperature_air). In the lower part, we can see the power generation. Around 2:20 PM, the feed-in to the grid was experimentally limited to 0W.
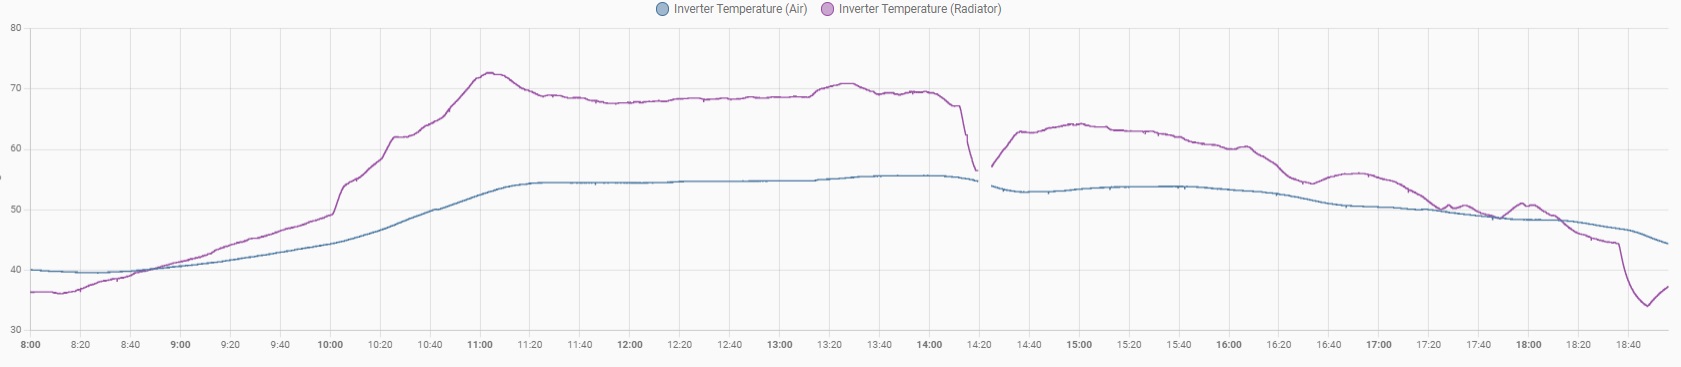
Without active cooling – (April 9, 2024, room temperature 18–20°C) – The graph shows a comparison of both temperatures measured by the inverter during the same period as in the graph above. The radiator temperature (temperature_radiator) slightly exceeded 70°C. The air temperature (temperature_air) remained slightly above 55°C.